

Pre-defined Dashboards
Powerful & Scalable Platform

Our pre-defined objects include ready-to-go and customizable web and mobile dashboards that were designed using MicroStrategy, the most powerful and scalable enterprise analytics platform that allowed the creation of pixel perfect designs, taking advantage of specific mobile devices features, and support multiple storytelling of the same data.
By doing so, executives and business users can get answers at a glance, with uniformity and consistency across all interfaces, and create and share their own self-service insights in a secured and scalable enterprise environment.

Predefined Web & Mobile Dashboards
Use more than 350 out-of-the-box dashboards either from your desktop or mobile devices.

Predefined Metrics and KPIs
Leverage more than 2,500 pre-calculated metrics and Key Performance Indicators (KPIs) in your ad-hoc analysis.

Predefined Visualizations
Analyze your data from more than 3,000 predefined visualizations, such as maps, bar charts, bubble charts, time series, etc.

Governed Self-Service Analytics
Access your trusted data for ad-hoc analysis in a fast and effective way, leveraging the performance of 50+ predefined intelligent cubes.

Enterprise Federated Analytics
Our HOBI™ solutions are built on top of the acclaimed enterprise analytics & mobile platform delivering powerful data mining capabilities on trusted data with low cost of ownership.

Cloud Based Solution
Benefit from a cost effective cloud platform deployment and encourage self-service analytics in a trusted and governed environment.
Predefined & Customizable Industry Specific Dashboards
Whether you are a hotel owner, management company, or operator, our predefined and customizable dashboards are grouped to simplify your analysis. Start from a 30,000 ft executive view of your data and drill-down to the level of detail necessary to analyze operational or financial results. Click to view gallery of predefined dashboards ↓
Above Property Operational Analysis
Asset Managers can group properties and run multi-property analysis or comparison based on top line KPIs. Display the results by region, market, or property. Perform top/bottom ranking analysis by multiple attributes, such as hotel brand or management company, based on different operational or financial indicators.


Competitive and Ranking Analysis
Compare each property's operational and financial performance to its corresponding STR competitive sets, on a single property basis or as a group of properties against their aggregated comp sets. Do side-by-side comparison by Property, Brand, Market, Management Company, or Portfolio. Analyze multi-year results, including comparison with year-of-acquisition, or simply analyze current year data compared with last year, budgets and forecast, displayed in multiple time intervals.
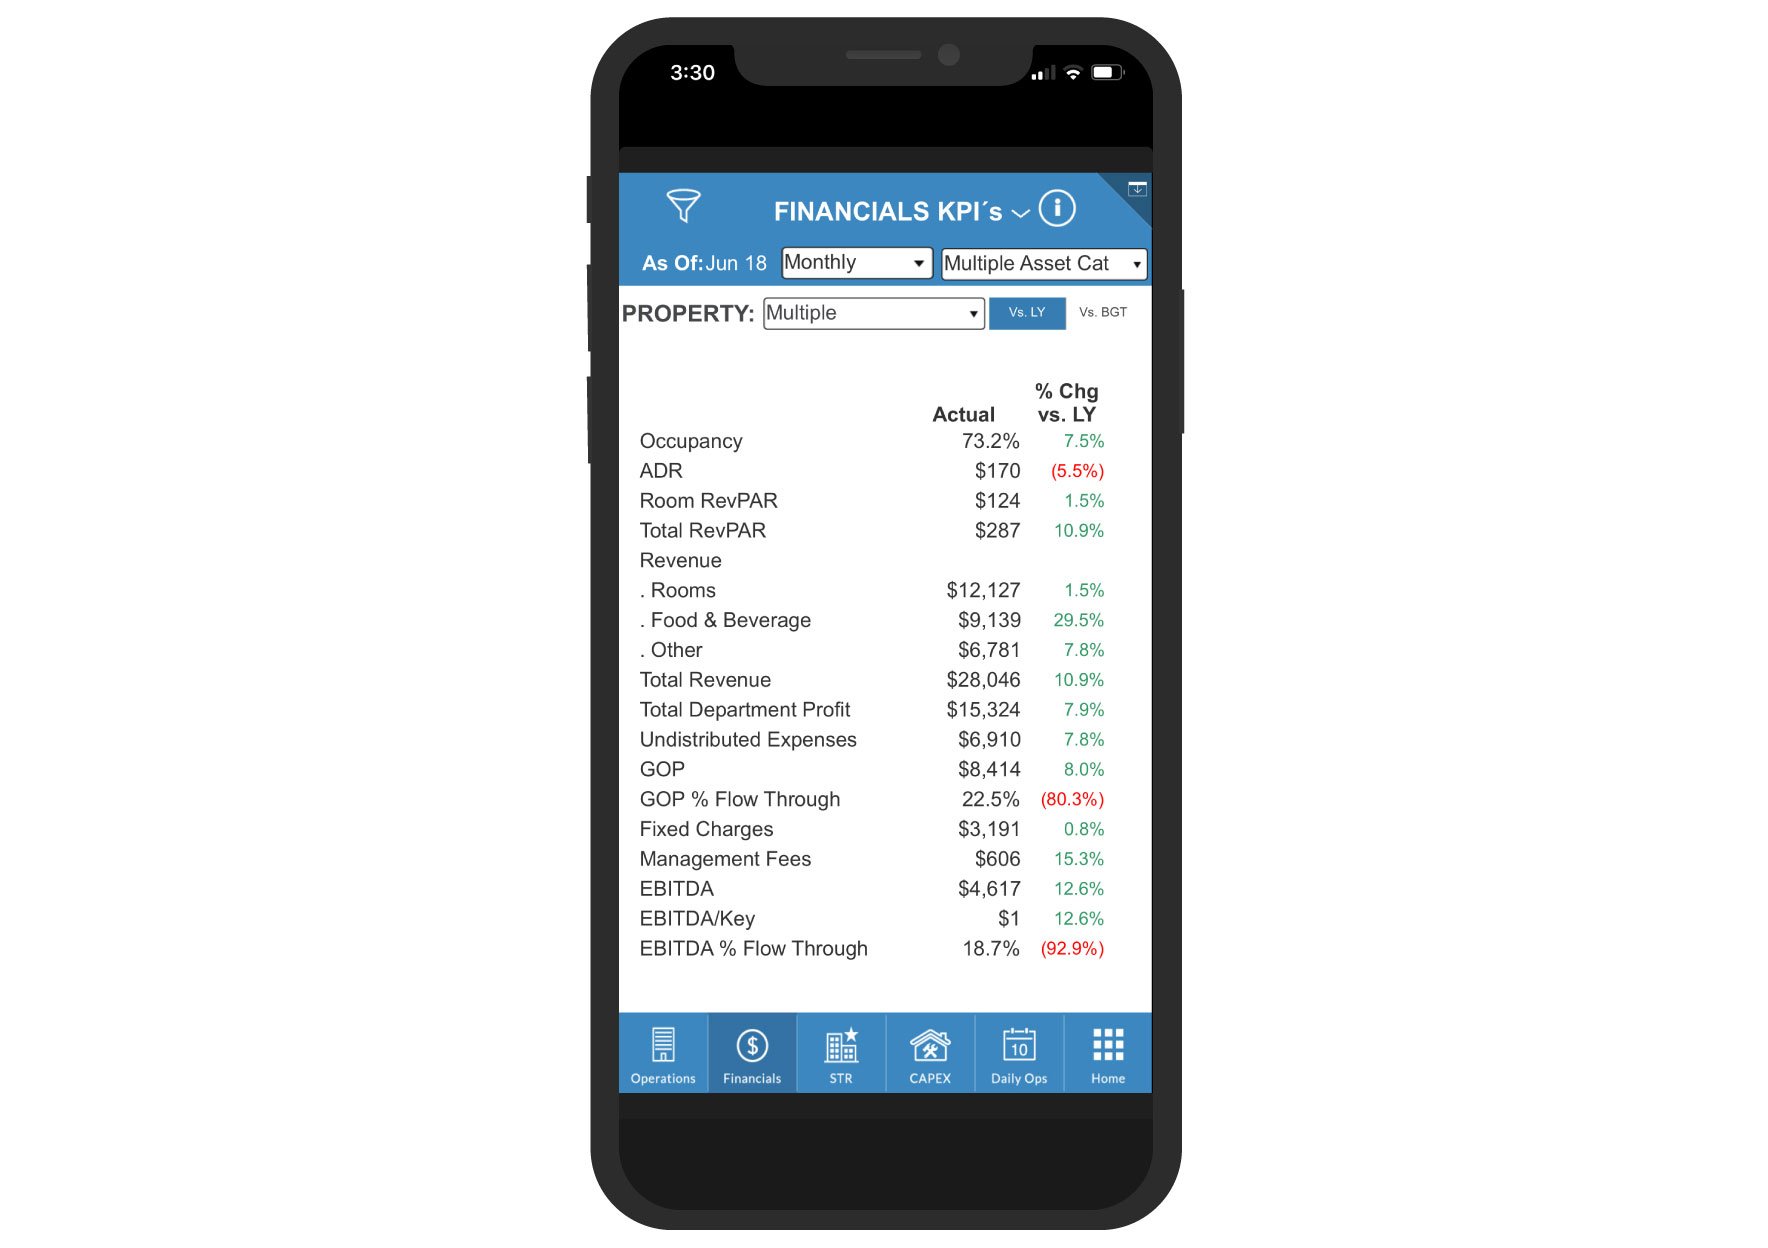
Property Specific Analysis
General Managers and property executives can review their respective property daily revenue, broken down by major departments, and analyze Room Revenue, ADR, Occupancy and RevPAR by specific market segments. They can also analyze the respective payroll expenses and statistics, as well as top operational expenses and their impact on GOP, EBITDA and associated flow calculations. They can do all this by comparing actual results, updated forecasts and annual budgets.

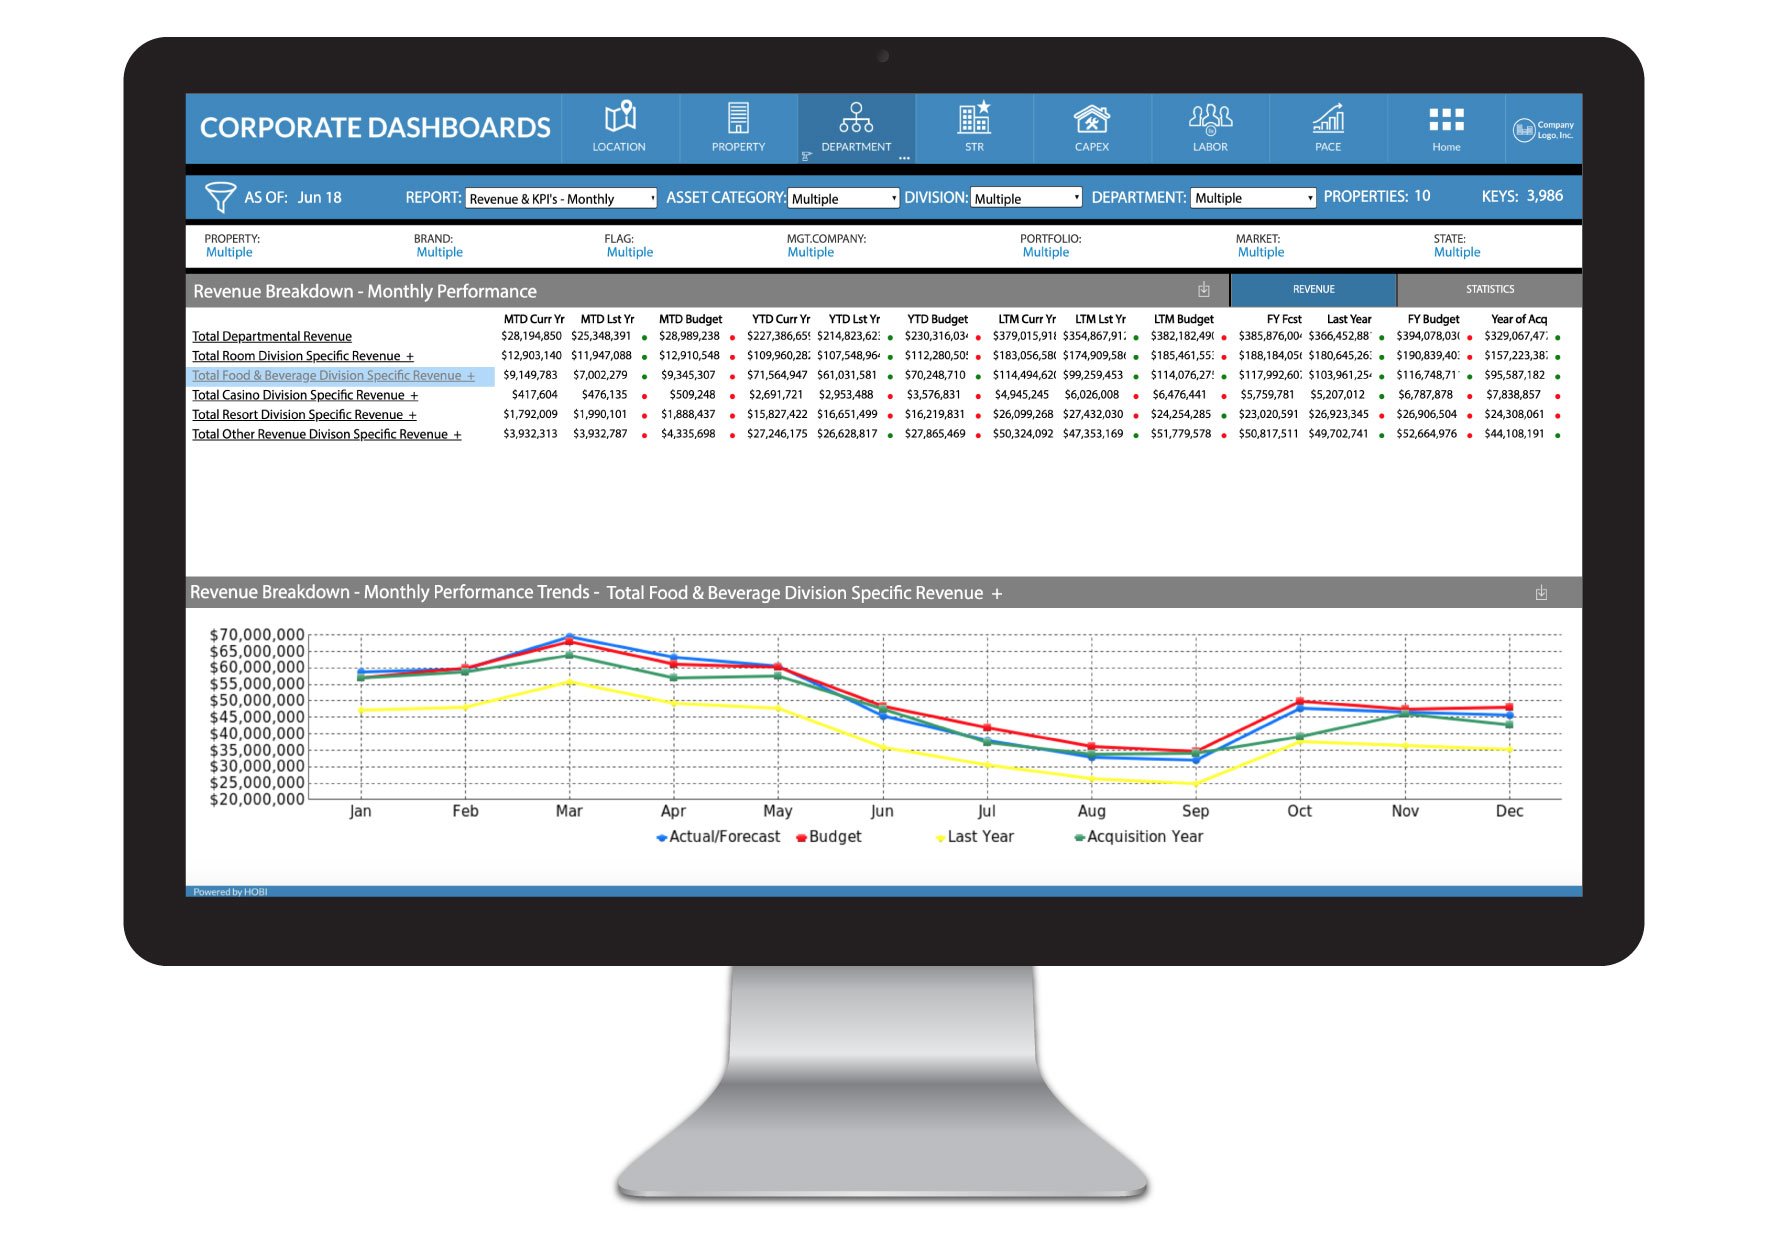
Departmental Specific Analysis
Property specific Division Directors and Department Managers can drill down into their specific divisions and departments performance, reviewing both operational and financial data. Corporate Business Line executives can aggregate the revenue, and statistical performance data from similar departments across multiple properties, including payroll and other operational expenses of both revenue generating and overhead departments.
Operational KPIs Analysis
Analyze your operational results using stunning visualizations, and discover hidden trends, relationships, and patterns. Leverage from hundreds of pre-defined operational metrics and KPIs by property or department. This will allow you to review your rooms operations results by specific market segments by each front-office location, or your food covers, capture and other F&B related KPIs by meal period by F&B outlet, or the number of golf rounds by type of player, etc.

Financial Results Analysis
Review the financial performance of your properties, and their respective departments, including P&L results, payroll expenses and labor analysis, and specific operational expenses. Analyze and aggregate this data in different time intervals or frequencies such as monthly, last 3 months, last 12 months, quarterly, annually, etc.
Gallery of Predefined Dashboards


Hotel Analytics
on the MicroStrategy Platform
As a MicroStrategy solution provider since 2010, we've designed our business intelligence solutions to take advantage of the powerful features and architecture of the enterprise analytics platform. Since then, we've been keeping our HOBI™ solutions predefined components compatible with the latest versions of their platform, running either on-premises, or on the cloud (using MicroStrategy Cloud, and/or MicroStrategy on AWS, and/or MicroStrategy on Azure).
The following are some of the key benefits of the MicroStrategy platform embedded in our HOBI™ solutions:
Amazing Mobile Apps
Increase productivity and efficiency by mobilizing your enterprise today and providing the best mobile user experience.
Performance & Scalability
New and integrated scalable and high performing in-memory engines achieve sub-second response times.
Low Total Cost of Ownership
Runs in the cloud, with zero up-front capital expenditure, leveraging experts & economies of scale, for minimum risks.
Monitoring & Automation Tools
Dozens of out of the box reports and dashboards to track and monitor usage to improve business efficiency.
Integration of Self-Service Analytics
Built-in capabilities to deploy a governed self-service project that maintains a single version of the truth.
Integrated Data Wrangling
Empowering data analysts to deliver deeper insights with intuitive and integrated data wrangling capabilities.
Flexible Development Platform
Makes it easy and efficient to build additional custom extensions around a standard HOBI™ solution that will continue evolving.
Enterprise-Grade Security
Multi-tier architecture that ensures integrity and protects your most sensitive information.
International Ready Platform
Multi-language features allow simpler and easy to maintain global deployments, and better user experience.
Hotel Analytics
using Microsoft Power BI
Connect to the HOBI Metadata in SSAS (SQL Server Analysis Services) by leveraging the existing connectivity within Microsoft PowerBI.
Share, interact, and collaborate on reports based on your data to find the insights, trends, and critical business intelligence you need.
The following are some of the key benefits of the Microsoft PowerBI platform:
Discover Relevant Reports
Find and access any relevant content - including reports you already built and pre-existing reports from either your organization or the PowerBI community.
Uncover Report Insights
Explore your reports to find and generate the quick insights you need for better business decisions.
Share Insights
Collaborate on reports with colleagues, then easily share the reports and insights when and how you want - in workspaces, on the web, in apps, or using Microsoft Teams.